Two great guides for starting an Analytics function are Tristan Handy’s The Startup Founder’s Guide to Analytics (2017), and Stephen Levin’s posts (2018), but a lot has changed with the technological landscape over the past two years. I wrote this article to help early-stage analytics leaders navigate both today’s analytics offerings. I also touch on the discussions with engineering, finance, and possibly exec teams that you didn’t realize you needed to have.
Over the past 5 years, analytics technology has coalesced around three components: an “ETL” tool to move data, a data warehouse to store said data, and a BI layer to look at the data. As your company grows, you will also realize you need a centralized business-logic layer, as well as an org plan for empowering teams to use analytics when the company is too big for you to personally know everyone.
I will start by covering the three key components. For each component I share which tools I evaluated, which one I chose, and my satisfaction level post-purchase. I also provide a framework for guiding the internal org discussion around purchasing or building this tool.
ETL Tool:
- I looked at: Stitch and Fivetran
- I chose: Stitch
- Satisfaction Grade w/ Stitch: A+
I chose Stitch for its affordable pricing and developer-friendly reputation. Stitch has been a no-nonsense piping tool that has saved us (back of the envelope calculation) ¼ of a FTE data engineer. The chat support is excellent, and it is surprisingly useful that they show raw log files for each ETL job (ah, need to rotate the API key for a data source!).
Org Discussion Points: For finance, Stitch costs far less than ¼ of a FTE Data Engineer, so this saves the company money from paying an engineer to do (unsatisfying) data work. Billing is monthly, per millions of rows synced, so you pay for what you use, which made it easy to explain to finance. You may get someone from engineering “We could do this ourselves, it is so easy”. Be very skeptical unless that person
- Has actually implemented and maintained an ETL pipeline for several years
- Is personally volunteering to do so, for you, in a timely manner
- Is excited to be on-call 24/7 to fix issues.
Database:
- I looked at: Postgres, Redshift, Snowflake, Google Cloud
- I chose: Snowflake
- Satisfaction Grade w/ Snowflake: A-
There are more posts comparing redshift, snowflake, and Big Query that there are rows in my snowflake database, so I will spare details. Although Snowflake doesn’t offer chat support, their technical support via email has been great
Org Discussion Points: Early on, I balked at the price and tried to use a postgres instance for analytics because we had a small amount of data. This was dumb, because the savings of (snowflake – postgres) * (time before we needed to switch to snowflake) is less than the cost of me and an SRE trying to diagnose random postgres issues once a week. For finance, the main issue you need to be prepared for is snowflake’s confusing billing system, for which I lower the rating to an A-. (Have fun explaining an itemized “cloud compute optimization fee” to your finance team).
Business Intelligence & Visualization:
- I looked at: AWS Quicksight, Periscope, Mode, Looker, Holistic, Metabase (Free), Superset (Free)
- I chose: Looker
- Satisfaction Grade w/ Looker: A
Since comparing options, Periscope, Looker, and Tableau have all been acquired, and I expect the landscape to continue changing rapidly in the next 12 months. I used Looker at my old job, and valued its excellent git, slack and email integrations, URL embedding, fantastic API (on which I presented at JOIN 2019), ability to automatically provision users via Google OAuth, simple SQL to graphs function, and, finally, their chat support.
Org Discussion Points:
Even though the BI purchase is expensive, I found it to be the least contentious since it is the only technology of the three that business people actually see. Build a value proposition by combining expected maintenance costs (in salary/opportunity cost) with the value of avoiding a bad decision due to bad data ($10K?). By my simple back of the envelope calculations, Looker ended up being cheaper than (free) Superset, because it largely runs itself.
This is one of the purchase decisions that may actually merit a deck or formal document outlining the pros and cons of each option. However, I regret over-democratizing the process by involving multiple business users to help make the decision by committee. At the end of the day, making simple dashboards is similar in each system, and it is you, not them, who will bear the burden of maintaining user/database permissions, query accuracy, and slack integrations. Reach out to the greater data community and hold yourself accountable to make the right decision.
I made one specific mistake here that I want to share: Looker was much more expensive than the other options, and, to explain the cost, I leaned on the value proposition of teams not needing to hire a dedicated analyst to write SQL queries. This was a mistake for two reasons:
-
Business users still need a baseline skill level to use Looker. A surprisingly effective rule-of-thumb is that if a person is comfortable with pivot tables in excel, they can do Looker. Do a quick calculation of how many people in your org need data, and of those, how many of them you would trust to make a pivot table.
-
There are benefits to hiring an analyst beyond simply doing SQL queries. Looker saved us from hiring an analyst, but that analyst could also have added value by connecting the dots of cross-functional business requests into product priorities. In a fast-growing startup, it doesn’t hurt to have another bright technical person around, and the earlier you hire them, the better.
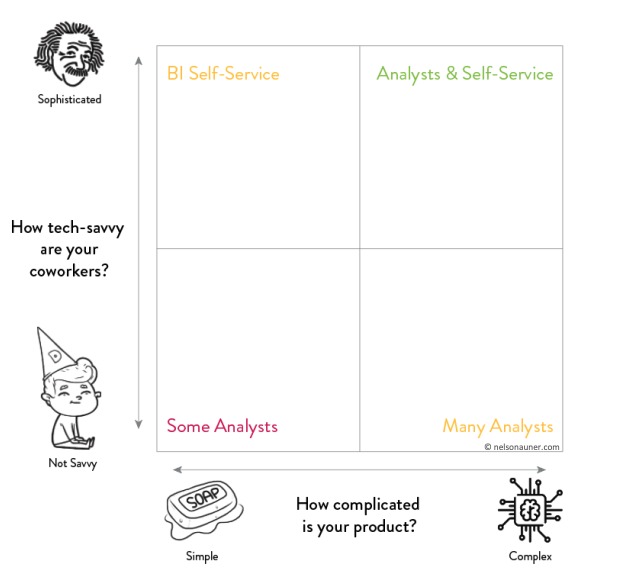
Here is a simple chart I wish I would have used to diagnose analytics needs:
On the plus side, Looker is a very mature product with excellent support and a vibrant user community. I don’t regret the decision to use Looker, but I regret using Looker as a reason to not bring on more data talent earlier.
This concludes the three main “courses” of an analytics stack. If you are still hungry, I will touch briefly on two increasingly necessary components as you continue to grow:
Business Logic Layer:
- I looked at: Looker, DBT
- I chose: DBT
- Satisfaction Grade w/ DBT: B
DBT is an open-source SQL/CLI-based system for centralizing and documenting the (business logic <-> data) interface. Once you get to more than 5 SQL writers, each will use slightly different JOIN conditions and aggregations, and it will cause problems, possibly technical problems (the same expensive queries getting run repeatedly) but certainly analytical problems as different teams build out slightly different queries for the same metrics. DBT overlaps a lot with LookML in this regard. If you don’t use Looker, you should definitely use DBT. If you do use Looker, the gains to using DBT are less. I opted to use DBT because it will make it much easier to move off of Looker, if I ever need to, allows us to use DBT’s cleaned data for data science instead of trapping that data in Looker, and has some more advanced features not found in LookML’s PDTs. You can opt for DBT open source or their paid hosted version, DBT Cloud. DBT Cloud is more user friendly, but still requires a fair amount of technical knowledge to operate.
Org Discussion Points: Since DBT is either free (run yourself) or very cheap (dbt cloud), this is likely an easy talk. I regret setting up DBT on an EC2 box instead of going directly to dbt’s paid cloud offering. DBT is much more technical than looker, so your average business user is either going to need to level up their command line skills, or not be involved in the DBT process. DBT Cloud doesn’t offer automated user provisioning, so this will be yet-another-tool to admin. Se la vie!
Org & On-going training:
Once you reach about 100 employees, the way you communicate cross-org is going to be more important than everything I just wrote about (unless you really screwed it up). There is a great post on this by TJ Murphy: Lessons learned managing the GitLab Data team. For a deeper dive on org structure (embedded or centralized analysts?), selecting KPIs, and driving prioritization, I recommend Carl Anderson’s “Creating a Data-Driven Organization” and, of course, Locally Optimistic blog